Views: 0 Author: Site Editor Publish Time: 2026-08-02 Origin: Site


Marine fender catalogs typically report performance data—Energy Absorption (EA) and Reaction Force (RF)—based on standard laboratory conditions. These standard conditions usually involve testing at 23°C ± 2°C and a compression speed of 0.15 m/s. Real-world berthing environments rarely match these baseline parameters. Relying strictly on catalog data without adjusting for temperature and velocity risks catastrophic infrastructure failure. Alternatively, you might severely over-spend on massive infrastructure you do not need. Port environments experience extreme heat and bitter cold. Approaching vessels strike fenders at varying speeds. We must account for these dynamic forces. This article provides port engineers and procurement teams with a clear, evidence-based framework. You will learn how to apply Temperature Factors (TF) and Velocity Factors (VF) properly. By utilizing these factors, you can specify the correct fender systems accurately and safely.
A cone fender’s rubber compound is viscoelastic; its stiffness changes dynamically with ambient temperature and berthing speed.
Temperature Factor (TF): Cold environments increase Reaction Force (risk to vessel hulls), while hot environments decrease Energy Absorption (risk to port structures).
Velocity Factor (VF): Higher berthing speeds typically increase both Energy Absorption and Reaction Force, requiring careful verification against maximum allowable hull pressures.
Procurement Standard: Legitimate correction factors must be backed by PIANC or CDIT-compliant full-scale testing, not just theoretical formulas.
Let us explore the massive gap between laboratory testing and harsh marine environments. A pristine lab setting differs vastly from an Alaskan winter. It also differs significantly from a Middle Eastern summer. Rubber behaves differently under extreme environmental stress. Catalog specifications provide a controlled baseline. They do not reflect operational reality. If we ignore TF and VF adjustments, the physical costs are severe.
Under-designing leaves your port with insufficient energy absorption. This failure leads to cumulative concrete fatigue. Over time, you will observe structural cracking along the quay wall. Vessel damage also becomes a high probability during aggressive berthing. Conversely, over-designing causes inflated capital expenditure on unnecessarily massive fenders. You waste budget on capacity you never actually utilize.
Our success criteria focus on achieving a structurally safe specification. We also demand an economically viable design. To accomplish this, we must establish accurate site-specific operational extremes. Integrating a Super Cone Fender requires aligning product capabilities with actual harbor conditions. You cannot simply guess the environmental impact. Port engineers must calculate operational corrections systematically.
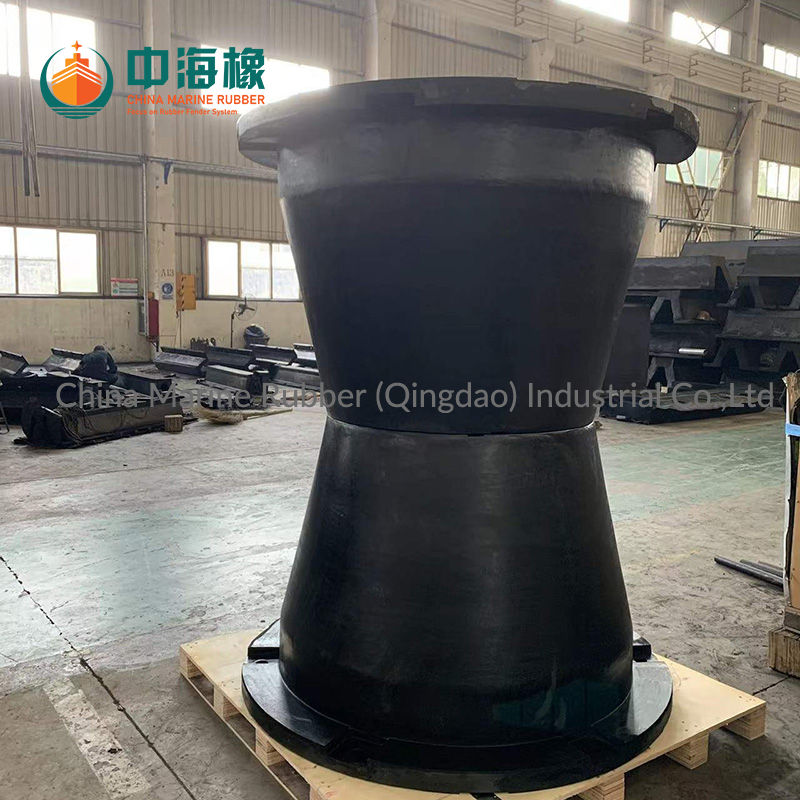
Let us examine the fascinating physics of rubber and heat. Ambient air and seawater temperatures directly alter rubber stiffness. Rubber is highly sensitive to thermal fluctuations. Large marine fenders possess immense thermal mass. They absorb ambient temperatures slowly but retain them deeply.
In low-temperature scenarios, such as cold climates, rubber stiffens considerably. This molecular stiffening leads to a significant spike in Reaction Force (RF). The primary evaluation dimension becomes vessel safety. We must ask: does the increased RF exceed the allowable hull pressure of the berthing vessel? If the fender pushes back too hard, the ship hull buckles.
In high-temperature scenarios, like hot climates, rubber softens. This softening leads to a critical drop in Energy Absorption (EA). The evaluation dimension shifts to infrastructure protection. Does the fender still absorb sufficient energy? Can it protect the quay wall at peak summer temperatures? If it compresses too easily, the vessel impacts the concrete.
Implementation reality demands precision from procurement teams. We advise buyers to use local historical temperature extremes.
Find the absolute lowest winter temperature on record.
Identify the highest summer peak temperature.
Determine the average seawater temperature during these extremes.
Use these extremes rather than annual averages. Averages mask the most dangerous operational days. Always request compound-specific TF data from manufacturers using these exact limits.
We must also understand the viscoelastic response to impact. The speed of compression, known as strain rate, directly affects standard performance curves. Rubber resists rapid deformation. It pushes back harder when struck quickly. Rubber does not behave like a simple steel spring. Its internal molecular chains resist sudden movement. When you force these chains to move rapidly, they create internal friction. This friction manifests as higher resistance or Reaction Force. Slower impacts allow the chains to slide past each other gently. This sliding reduces the Energy Absorption capacity.
High-speed berthing impacts drastically alter performance metrics. Faster compression generally yields higher EA and higher RF. The implementation risk is substantial in these scenarios. High-velocity impacts can push a seemingly adequate Cone Fender past safe reaction force limits. Fast ferries or poorly controlled cargo ships often cause these rapid impacts. You must verify if the structural limits accommodate this sudden force spike.
Conversely, low-speed or creep berthing presents entirely different challenges. Extremely slow berthing speeds may result in lower-than-catalog Energy Absorption. Large vessels moving carefully in restrictive waterways compress fenders slowly. The rubber yields more easily under slow, sustained pressure. You must account for this EA drop to prevent bottoming out the fender.
Secondary considerations include cyclic conditions. Repeated, rapid impacts create material fatigue. They interact heavily with velocity. These dynamic environments require robust shear and deflection capabilities. If a fender absorbs multiple impacts quickly, internal heat builds up. This heat alters the rubber's stiffness again. You must analyze velocity and cycle frequency together.
Port engineers require a standard evaluation framework for safety. We use a specific formula structure to determine actual performance. Let us review these essential calculations.
Actual EA = Catalog EA × TF (for EA) × VF (for EA)
Actual RF = Catalog RF × TF (for RF) × VF (for RF)
You must understand the complex interaction of these variables. TF and VF are never mutually exclusive. They interact dynamically during every single berthing event. You must calculate them simultaneously. Always base these calculations on worst-case berthing scenarios.
For example, evaluate the maximum approach speed during the coldest month. This combination produces the highest possible Reaction Force. Next, evaluate the slowest approach speed during the hottest month. This combination produces the lowest possible Energy Absorption.
We must also maintain transparent assumptions regarding materials. Different rubber grades possess unique TF and VF curves. Standard, high-performance, and low-reaction grades behave differently under stress. Natural rubber and synthetic blends react uniquely to temperature. Be wary of one-size-fits-all generic correction tables. They are massive red flags in procurement. A legitimate Super Cone Fender specification demands compound-specific test data.
Environmental Scenario | Temperature Effect (TF) | Velocity Effect (VF) | Primary Risk Consideration |
|---|---|---|---|
Cold Winter + High Speed | Significant RF Increase | Additional RF Increase | Vessel hull pressure overload |
Hot Summer + Low Speed | EA Decrease | Further EA Decrease | Quay wall structure damage |
Cold Winter + Low Speed | RF Increase | EA Drop | Mixed hazard (vessel and wall) |
Hot Summer + High Speed | EA Drop | EA Increase | Unpredictable force distribution |
Evaluating manufacturers requires strict adherence to global industry standards. PIANC WG33 guidelines provide the ultimate technical authority. CDIT testing protocols also serve as essential benchmarks. Require all manufacturers to provide correction factor curves strictly aligned with these guidelines.
The PIANC WG33 framework was created specifically to eliminate dangerous guesswork. Before PIANC, manufacturers often published highly optimistic catalog data. Today, PIANC requires standardized break-in cycles before recording data. They mandate precise rest periods between compressions. This rigor ensures complete reliability for baseline data. Only from this reliable baseline can we calculate accurate TF and VF adjustments.
You must evaluate evidence over marketing claims. Demand verifiable, compound-specific testing data. This data must match the exact cone fender model and rubber grade being specified. Do not accept generic testing results.
Reject extrapolated data derived from miniature rubber samples. Miniature samples fail to replicate true thermal mass. They cure differently during the manufacturing process. Insist on data correlated directly with full-scale fender testing. Full-scale tests reveal how the massive rubber block truly behaves under stress.
For next-step actions in procurement, establish firm demands. Request a customized engineering performance report from your shortlisted suppliers.
Demand site-specific temperature extreme calculations.
Require velocity factor adjustments based on your design vessel.
Review the full-scale test certificates for the proposed rubber compound.
This report must detail TF and VF calculations for the specific project site. Secure this critical documentation before entering the bidding phase.
Temperature and velocity are never marginal variables in port design. They act as primary drivers of marine fender performance and safety. Ignore them, and you invite structural failure.
Standard catalog specifications merely serve as a starting point. Final procurement decisions must always rely on corrected, site-specific performance data. Protect your infrastructure by demanding rigorous mathematical accuracy from suppliers.
We recommend engaging a qualified marine engineering team early. Have them run project-specific TF and VF calculations immediately. Review full-scale test data for your required Super Cone Fender. Never guess when structural integrity and maritime safety are at stake.
A: No. Different rubber compounds, such as natural versus synthetic blends, have unique thermal and strain-rate properties. Every compound responds differently to environmental stress. Consequently, factors must be strictly specific to the actual compound used in manufacturing. Generic tables provide inaccurate, unsafe estimates.
A: PIANC establishes a rigid baseline testing protocol. It mandates testing at 23°C and a specific compression speed. Beyond the baseline, PIANC outlines the rigorous methodology manufacturers must follow. They use these standardized testing methods to develop and report their specific correction factors accurately.
A: Yes. While VF primarily measures perpendicular impact speed, real-world berthing involves complex forces. Angular berthing introduces heavy shear forces. Cyclic loads cause rapid heat buildup, fundamentally altering the internal temperature of the rubber. This internal heating can compound the effects of both TF and VF simultaneously.